ClickHouse Monitoring
Comprehensive ClickHouse database monitoring solution. Track query performance, memory usage, disk space, database health, and connection status in real-time. Optimize your ClickHouse infrastructure with detailed analytics and instant alerts.
Why UptimeDock?
Advanced ClickHouse Monitoring
Query Performance Analytics
Monitor query execution times, CPU usage, memory consumption, and I/O metrics. Identify slow queries with detailed breakdowns of read/write operations, result sizes, and error counts to optimize database performance.
Memory & Resource Tracking
Track total and used memory, background operations, merge processes, and dictionary memory usage. Set alerts for memory thresholds to prevent out-of-memory issues and maintain optimal performance.
Disk Space Management
Monitor total disk usage, capacity, and free space across your ClickHouse cluster. Track database and table disk sizes with compression ratios to optimize storage and prevent disk space issues.
Database Health Insights
Get comprehensive database summaries including row counts, table counts, part counts, and compression ratios. Monitor table fragmentation and mutation status to maintain optimal database health.
DATABASE PERFORMANCE
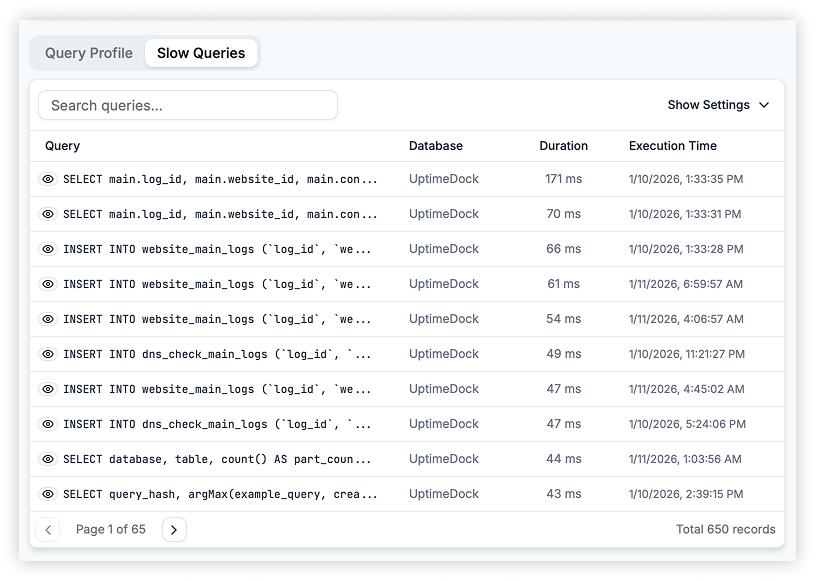
Slow Query Detection
Automatically identify and track slow-running queries in your ClickHouse database. Our monitoring system analyzes query execution patterns, aggregating performance metrics by query hash to help you understand which queries need optimization.

View detailed breakdowns including P99 latency, average duration, CPU time, memory usage, and I/O statistics. Track execution counts and error rates to prioritize optimization efforts.

Get insights into read/write patterns, result sizes, and identify queries that impact your database performance the most.
PROACTIVE MONITORING
Intelligent Alert System
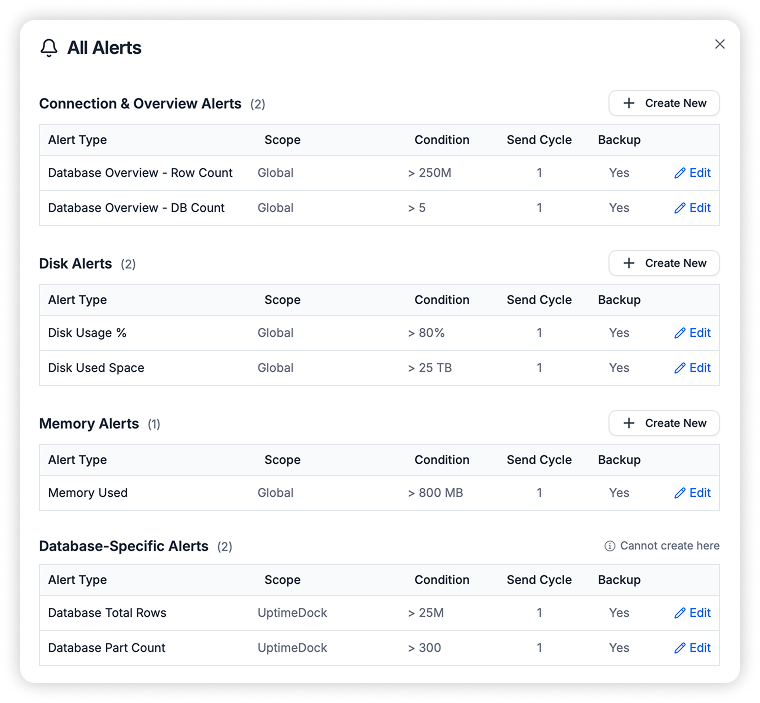
Set up custom alerts for every aspect of your ClickHouse database. Monitor connection status, response times, disk usage, memory consumption, and query performance metrics.

Configure thresholds for database metrics like row counts, disk sizes, table counts, and part counts. Track table-specific alerts including disk size, active parts, and fragmentation levels.

Receive instant notifications via email, SMS, or integrations when thresholds are exceeded. Set up maintenance windows to avoid false alerts during planned operations.
RESOURCE OPTIMIZATION
Comprehensive Resource Monitoring
Track memory usage across all ClickHouse processes including background operations, merge processes, fetches, and dictionary memory. Monitor total and used memory with percentage utilization to prevent out-of-memory issues.

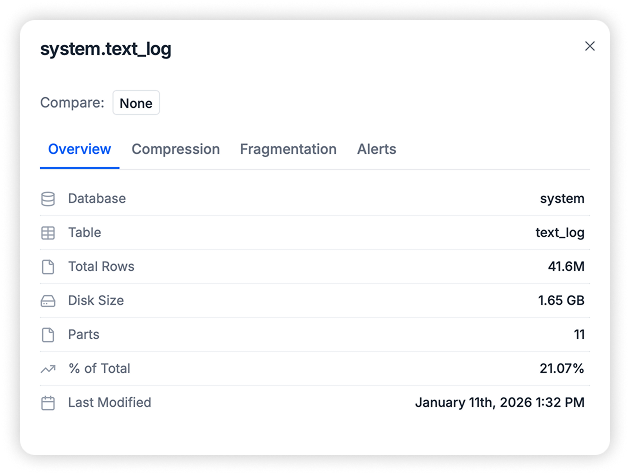
Keep tabs on disk space utilization with detailed breakdowns by database and table. Track compression ratios, compressed vs uncompressed sizes, and identify storage optimization opportunities.

View historical trends and patterns to plan capacity upgrades and optimize resource allocation for your ClickHouse infrastructure.
DATABASE HEALTH
Table & Database Analytics
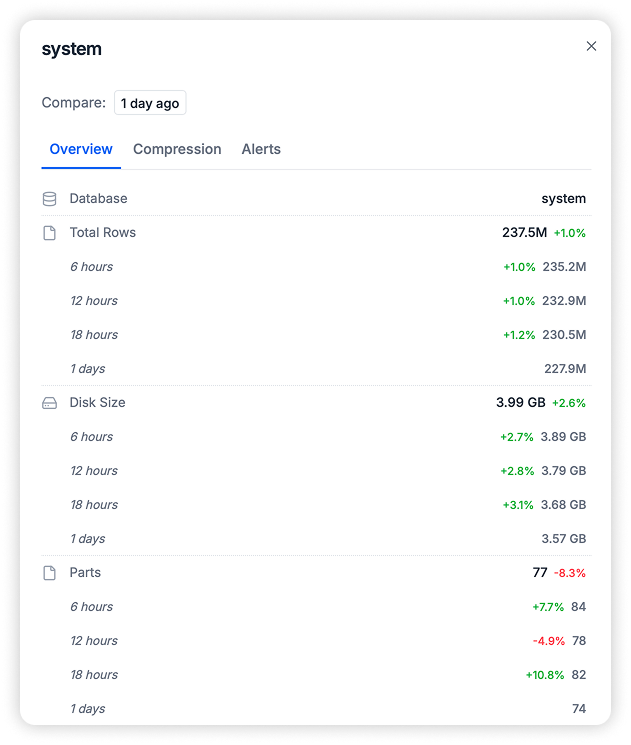
Get a complete overview of your ClickHouse databases with detailed metrics for each database including total rows, disk size, table counts, and part counts. Monitor last modification times and track database growth over time.

Identify fragmented tables and track mutation status to maintain optimal query performance. Monitor average rows per part and part sizes to detect fragmentation issues early.

Use our analytics to optimize your table structures, plan merge operations, and ensure your ClickHouse databases are running at peak efficiency.
Get started
Start monitoring your website's availability and dive into all this powerful features right now!
Try Free
* Don't worry, we don't need your credit card for trial 😊