Replication Monitoring
UptimeDock provides comprehensive monitoring for ClickHouse replicated tables. Track replication health, lag, queue sizes, and get instant alerts when issues arise.
Overview
ClickHouse supports data replication through the ReplicatedMergeTree family of table engines. Replication provides high availability and fault tolerance by maintaining identical copies of data across multiple servers.
UptimeDock automatically monitors all replicated tables in your ClickHouse instance, providing:
- Real-time health status – Instantly see if replicas are healthy or experiencing issues
- Replication lag tracking – Monitor how far behind replicas are from the leader
- Queue monitoring – Track pending inserts and merges in the replication queue
- ZooKeeper status – Detect ZooKeeper connectivity issues
- Lost parts detection – Identify data integrity issues
Automatic Detection
Replication monitoring is automatically enabled when UptimeDock detects replicated tables in your ClickHouse instance. There's no additional configuration required.
If your instance has at least one table using a ReplicatedMergeTree engine (or any of its variants like ReplicatedReplacingMergeTree, ReplicatedSummingMergeTree, etc.), the replication monitoring features will appear automatically in your reports.
To monitor replication status, your monitoring user needs SELECT access to thesystem.replicas table. See our Database Configuration guide for setup instructions.
Replication Summary
The Replication tab in the main report view provides a high-level overview of your replication status. This summary shows:
- Replicated Tables – Total number of replicated tables with healthy/unhealthy breakdown
- Max Delay – The longest replication lag across all tables
- Read-only Tables – Number of tables in read-only mode (indicating issues)
- Lost Parts – Total count of lost data parts across all tables
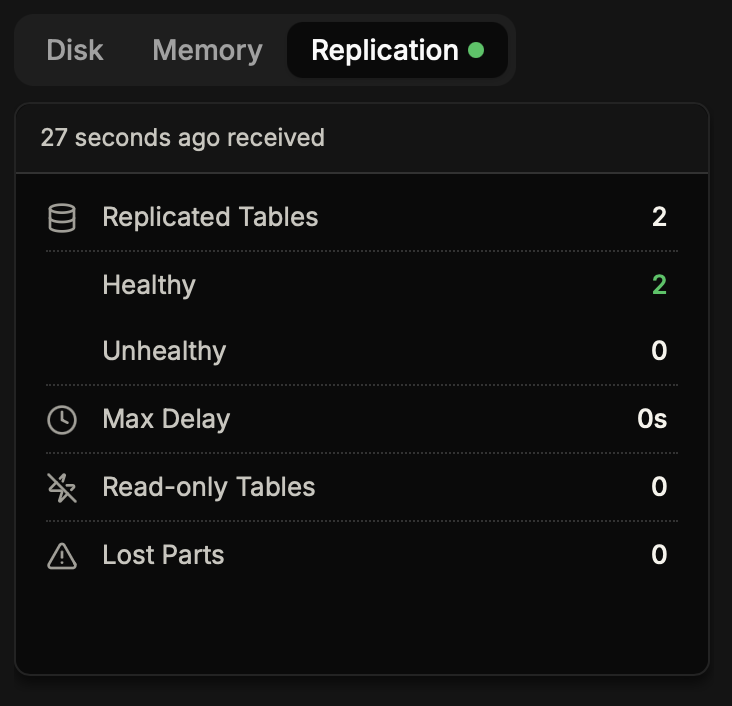
A green dot next to the Replication tab indicates all replicated tables are healthy. A red dot indicates one or more tables have issues that need attention.
Database Replication View
Click on a database name to open its details, then navigate to the Replication tab. This view shows all replicated tables within that specific database:
- Table Name – Name of the replicated table (clickable to view details)
- Status – Healthy or Unhealthy indicator
- Replicas – Number of active replicas out of total (e.g., "2 / 2")
- Delay – Current replication lag in seconds
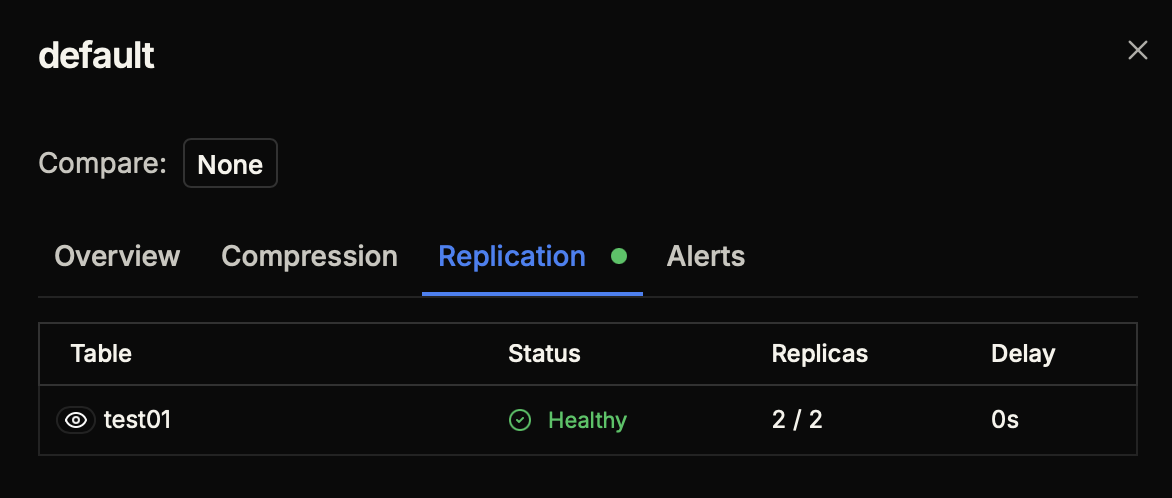
Table Replication Details
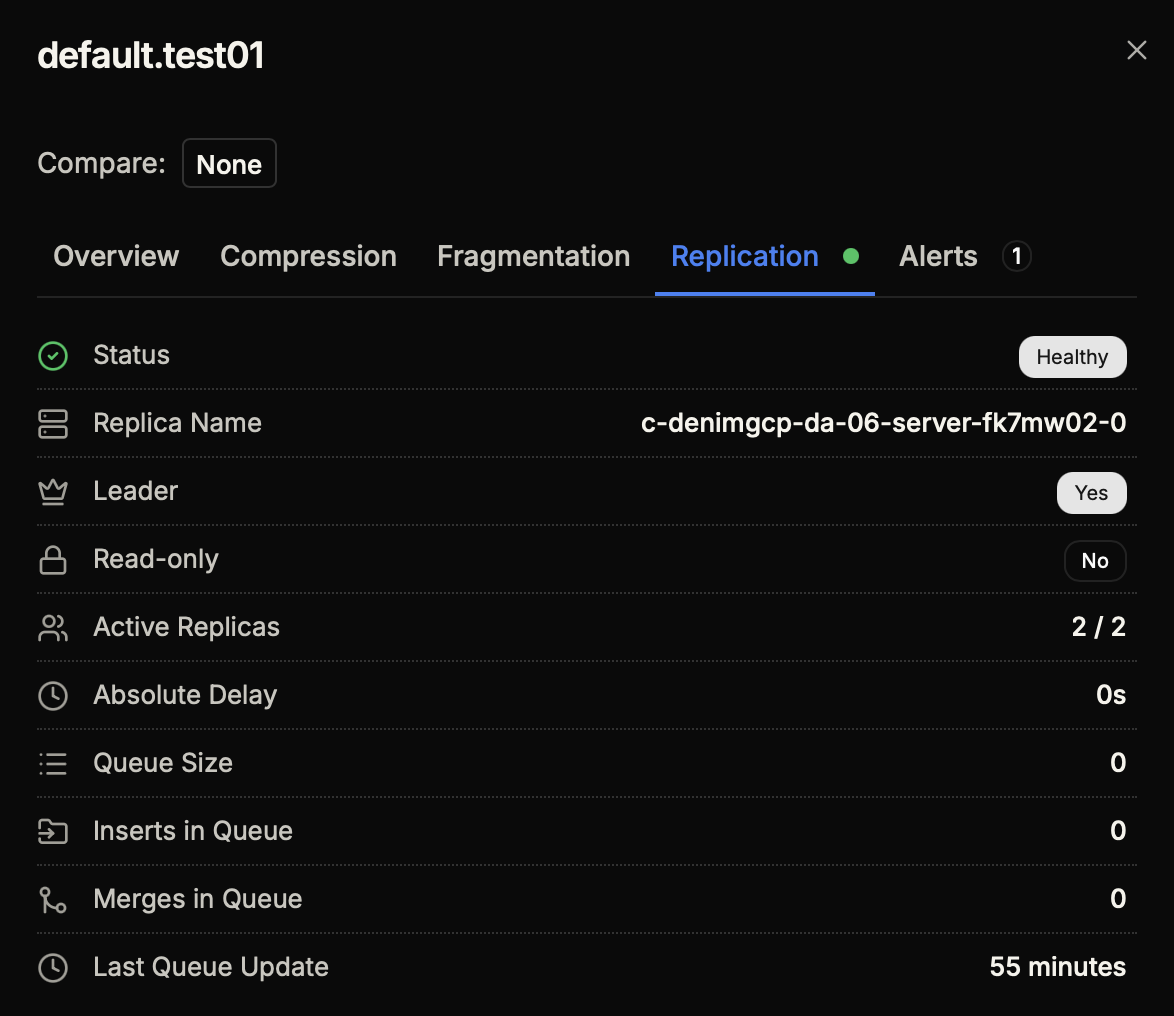
For the most detailed view, click on a table name to open its details and navigate to the Replication tab. This provides comprehensive information about the table's replication status:
| Metric | Description |
|---|---|
| Status | Overall health status (Healthy/Unhealthy) |
| Replica Name | Unique identifier of this replica in the cluster |
| Leader | Whether this replica is the current leader (Yes/No) |
| Read-only | Whether the table is in read-only mode (indicates ZooKeeper issues) |
| Active Replicas | Number of replicas currently active out of total configured |
| Absolute Delay | Time behind the leader in seconds |
| Queue Size | Number of operations waiting in the replication queue |
| Inserts in Queue | Number of pending INSERT operations |
| Merges in Queue | Number of pending MERGE operations |
| Last Queue Update | Time since the replication queue was last processed |
Health Indicators
Throughout the interface, you'll see colored dots indicating replication health:
- Green – All replicated tables are healthy
- Red – One or more tables have replication issues
These indicators appear on:
- Database names in the Databases tab
- Table names in the Tables tab
- Replication tab triggers in popups
- Main Replication summary tab
A replicated table is considered unhealthy if any of these conditions are true:
- Table is in read-only mode
- There are lost parts
- ZooKeeper exceptions are present
- Replication lag exceeds acceptable thresholds
- Not all replicas are active
Replication Alerts
Set up alerts to be notified immediately when replication issues occur. Replication alerts can be created from the Alerts tab in any table's detail popup.
Available Alert Types
| Alert Type | Description | Condition |
|---|---|---|
| Replication Unhealthy | Triggers when table becomes unhealthy | No condition (boolean) |
| Replication Lag | Triggers when replication delay exceeds threshold | Seconds (e.g., > 60s) |
| Replication Lost Parts | Triggers when lost parts are detected | Count (e.g., > 0) |
| Replication Readonly | Triggers when table enters read-only mode | No condition (boolean) |
| Replication Queue Size | Triggers when queue size exceeds threshold | Count (e.g., > 100) |
| Replication Active Replicas | Triggers when active replicas fall below threshold | Count (e.g., < 2) |
| Replication ZooKeeper Error | Triggers when ZooKeeper exceptions occur | No condition (boolean) |
| Replication Not Exists | Triggers when a replicated table disappears | No condition (boolean) |
We recommend setting up at least these alerts for critical replicated tables:
- Replication Unhealthy – Catch-all for any replication issues
- Replication Lag > 300s – Alert when replica falls more than 5 minutes behind
- Replication Lost Parts > 0 – Immediate alert for data integrity issues
For more information on setting up alerts, see our Alerts & Notifications guide.