Alerts & Notifications
UptimeDock allows you to configure alerts for your ClickHouse database to get notified when specific conditions are met. This guide covers all available alert types, how to configure them, and best practices for effective monitoring.
Overview
Alerts in UptimeDock help you proactively monitor your ClickHouse database health. When a configured condition is met (e.g., disk usage exceeds 80%), UptimeDock sends notifications to your selected notification group via email, Slack, or other configured channels.
You can view and manage all alerts for a check by clicking the "All Alerts" button in the check's dashboard. This opens a popup showing all configured alerts organized by category.

Alert Scopes
Alerts in UptimeDock have different scopes depending on what they monitor:
Global Alerts
Global alerts apply to the entire ClickHouse instance and can be created directly from the "All Alerts" popup. These include:
- Connection & Overview Alerts – Monitor connection status and high-level database metrics
- Disk Alerts – Track disk usage across the entire instance
- Memory Alerts – Monitor memory consumption
Specific Alerts
Some alerts require a specific scope (database, table, or query) and must be created from the corresponding section in the Reports dashboard:
- Database-Specific Alerts – Created from the Database section, applies to a specific database
- Table-Specific Alerts – Created from the Table section, applies to a specific table
- Query-Specific Alerts – Created from the Query section, applies to a specific query pattern
To create database, table, or query-specific alerts, navigate to the corresponding section in your check's Reports dashboard and click the "Alerts" button for the item you want to monitor.
Alert Categories
Connection & Overview Alerts
These alerts monitor the overall health and connectivity of your ClickHouse instance.
| Alert Type | Description | Use Case |
|---|---|---|
| Connection Down | Triggers when UptimeDock cannot connect to your ClickHouse instance | Critical for detecting outages and connectivity issues |
| Connection Response Time | Triggers when connection latency exceeds a threshold | Detect slow connections before they impact performance |
| Database DB Count | Triggers when the number of databases exceeds a threshold | Monitor database sprawl or unexpected database creation |
| Database Table Count | Triggers when total table count exceeds a threshold | Detect table proliferation across all databases |
| Database Row Count | Triggers when total row count exceeds a threshold | Monitor data growth across the instance |
Disk Alerts
Disk alerts help you prevent storage-related issues before they cause problems.
| Alert Type | Description | Recommended Threshold |
|---|---|---|
| Disk Used Space | Triggers when used disk space exceeds a specific size (GB/TB) | Based on your capacity planning |
| Disk Free Space | Triggers when free disk space falls below a threshold | < 50 GB or < 20% of total |
| Disk Usage % | Triggers when disk usage percentage exceeds a threshold | > 80% (warning), > 90% (critical) |
Running out of disk space can cause ClickHouse to stop accepting writes and potentially corrupt data. Always set up disk alerts with adequate lead time for capacity planning.
Memory Alerts
Memory alerts help you detect memory pressure before it leads to out-of-memory (OOM) errors.
| Alert Type | Description | Recommended Threshold |
|---|---|---|
| Memory Used | Triggers when memory usage exceeds a specific size (MB/GB) | 70-80% of available memory |
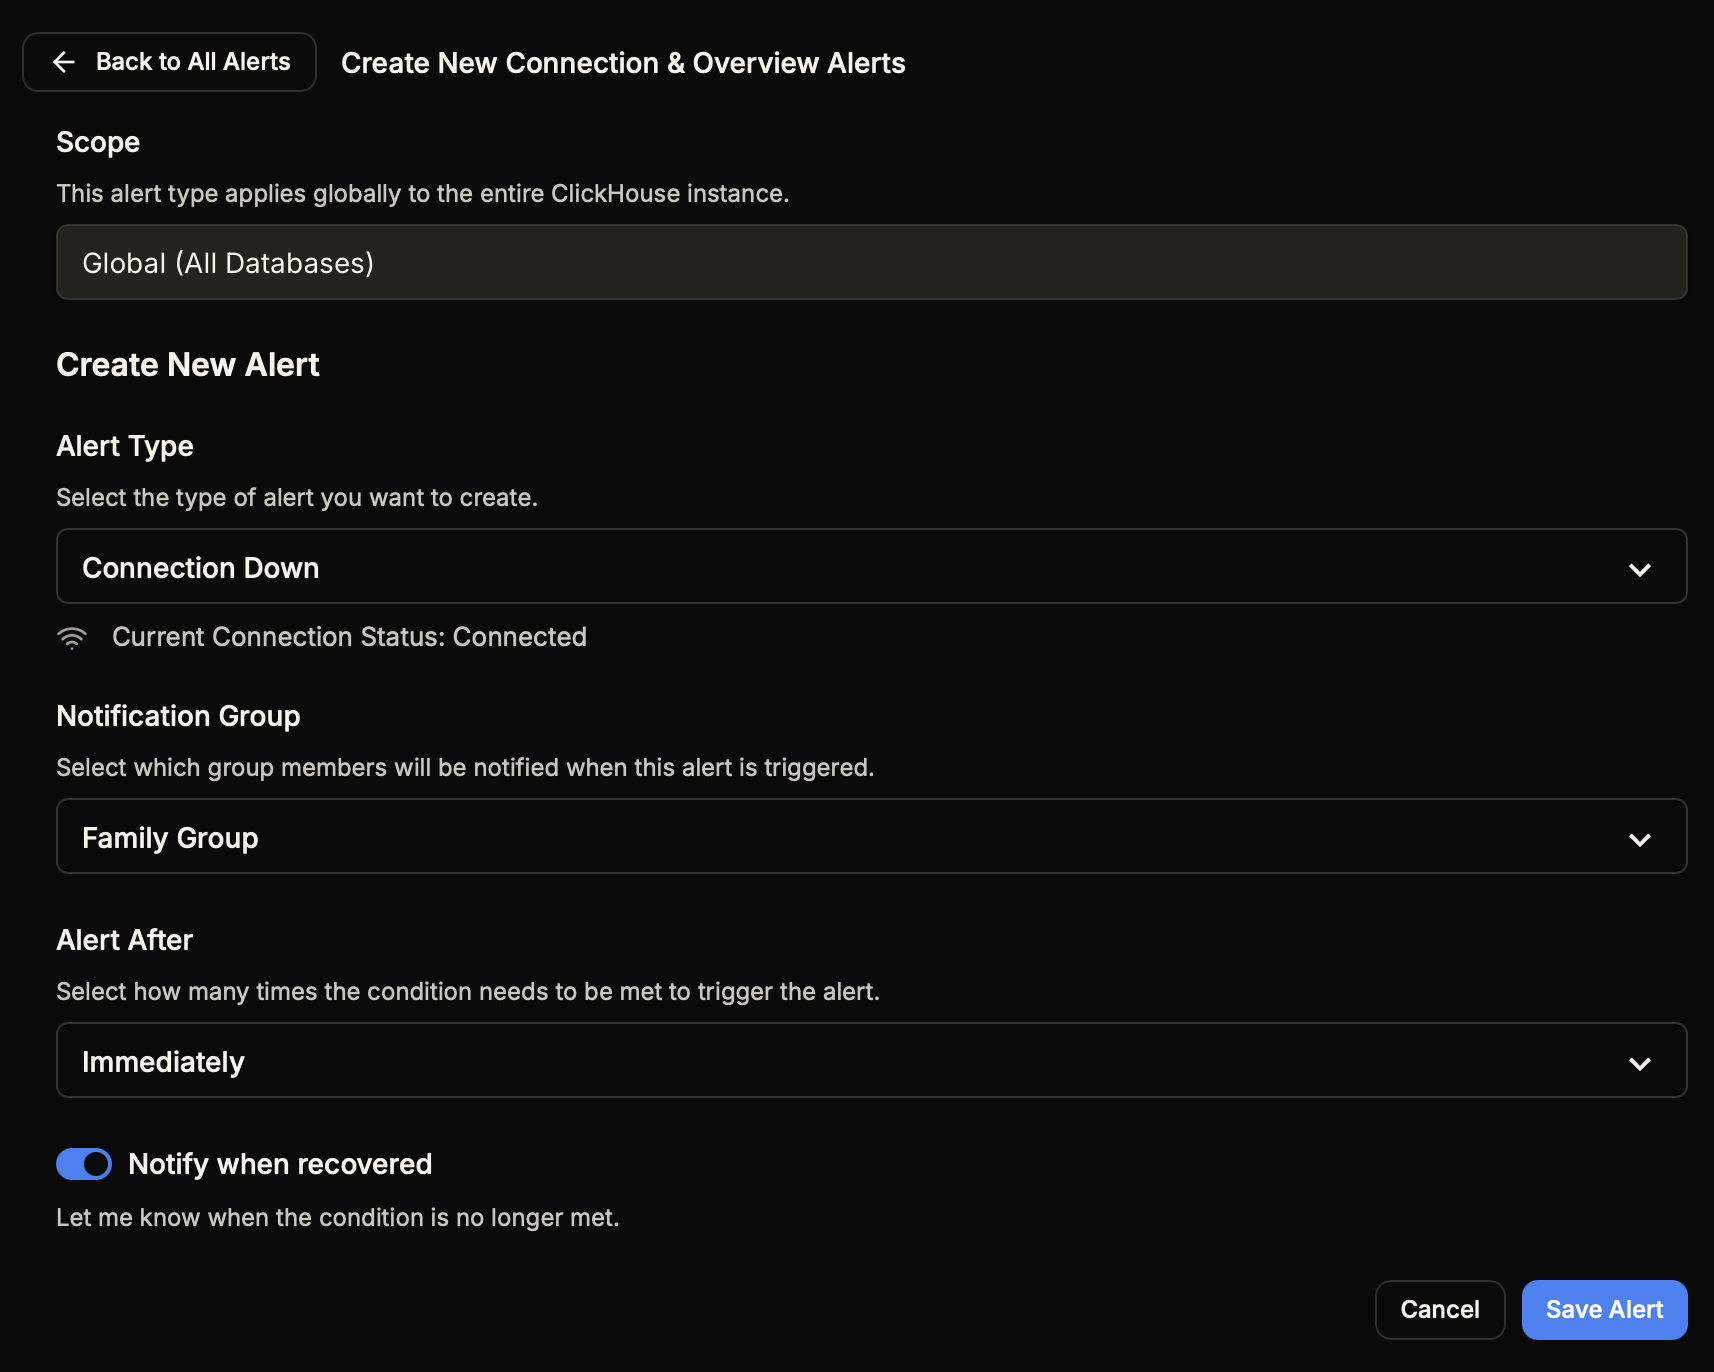
Creating Alerts
To create a new alert:
- Open your ClickHouse check dashboard
- Click "All Alerts" to open the alerts popup
- Find the alert category you want (e.g., "Disk Alerts")
- Click "+ Create New"
- Configure the alert settings (see below)
- Click "Save Alert"
Alert Configuration Options
When creating an alert, you'll configure the following options:
| Option | Description |
|---|---|
| Scope | The scope of the alert (Global, Database, Table, or Query). Displayed but not editable for global alerts. |
| Alert Type | The specific metric to monitor. Options depend on the alert category. |
| Condition | The threshold that triggers the alert. Set the operator (>, <, =) and value with unit (MB, GB, TB, %). |
| Notification Group | Select which contact group receives alerts. Manage groups here. |
| Alert After | How many consecutive check cycles the condition must be met before triggering. "Immediately" triggers on first occurrence. |
| Notify when recovered | When enabled, sends a recovery notification when the condition is no longer met. |
Recommended Thresholds
Here are our recommended alert thresholds for ClickHouse monitoring:
| Metric | Warning | Critical |
|---|---|---|
| Disk Usage % | > 70% | > 85% |
| Memory Used | > 70% of available | > 85% of available |
| Connection Response Time | > 500ms | > 2000ms |
These are general recommendations. Adjust thresholds based on your specific workload patterns, hardware specifications, and SLA requirements.
Best Practices
- Set up Connection Down alerts first – This is the most critical alert that tells you when your database is unreachable.
- Use tiered alerting – Create both warning and critical alerts for metrics like disk usage to get early warnings before critical situations.
- Enable recovery notifications – This helps you confirm when issues are resolved without manually checking the dashboard.
- Use "Alert After" wisely – For metrics that naturally fluctuate (like memory), consider setting "Alert After" to 2-3 cycles to avoid false positives.
- Organize notification groups – Create separate notification groups for different severity levels or teams to ensure the right people are notified.
- Review and tune regularly – As your database grows and usage patterns change, revisit your thresholds to ensure they're still appropriate.
After setting up basic alerts, explore Query Performance Monitoring to set up alerts for slow queries, or Disk Space Management for more detailed storage monitoring strategies.